Project Status Report Template: A Weekly Update in 5 Minutes
By OnGrid · 26 October 2026 · 8 min read
In short
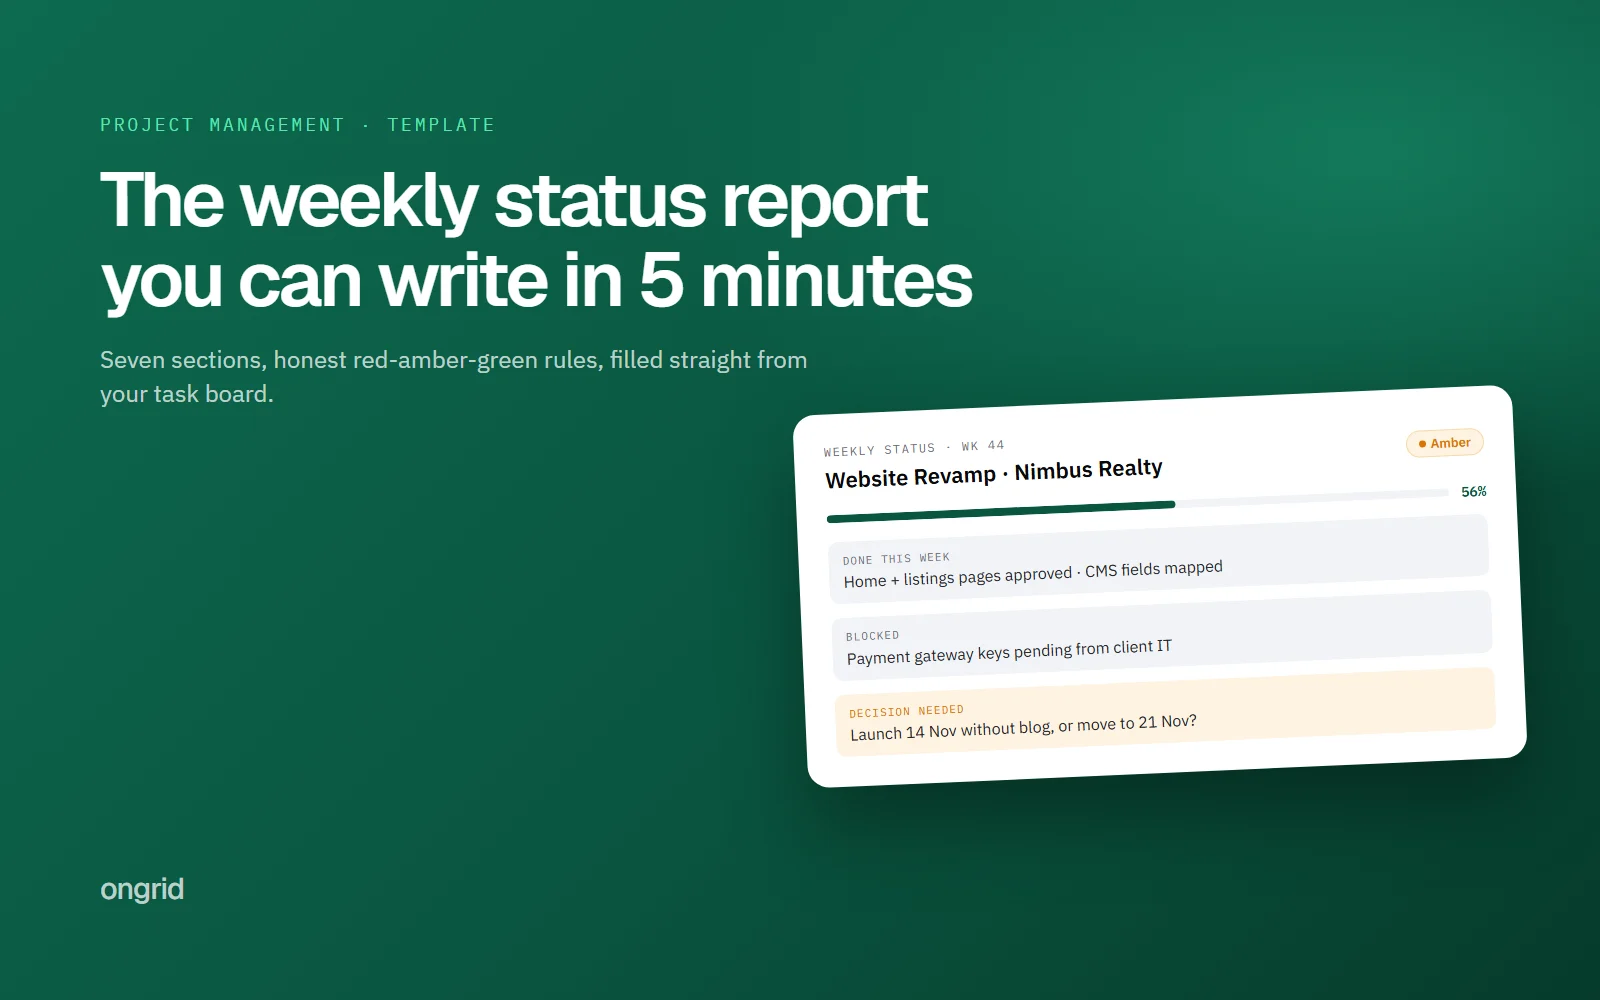
- A good weekly project status report has seven fixed sections: overall status, done this week, next week, risks, blockers, decisions needed, and dates and budget. Define what green, amber and red mean before the project starts, make every amber name its fix and every red name the decision needed, and fill it from your task board so it takes five minutes, not an evening.
It's Friday, 6:40 pm. The project manager opens a blank email, types "Project is on track", adds three bullet points from memory and hits send. On Tuesday the client asks why the launch date moved. Nobody lied. The report was just written from memory instead of from the work.
A good project status report template fixes that. It gives you the same seven boxes every week, forces an honest status, and takes about five minutes to fill if you pull it from your task board. Below is the template we recommend for agencies and service teams, a worked example with real numbers, and the rules that stop "green" from meaning "I haven't checked".
What is a project status report, and how is it different from a client report?
A weekly project status report answers one question: will we deliver what we promised, on the date we promised? It covers delivery. What got done, what's next, what's at risk, and what someone needs to decide.
It is not the same as a monthly results report, where you show a client what the work achieved: traffic, leads, sales, campaign numbers. That one looks backwards at outcomes. If that's what you need, read our client reporting template instead. The status report looks forward at dates.
Most teams need both. Mixing them is how you end up with a 12-slide deck every Friday that nobody reads.
What should a weekly project status report include?
Seven sections. Keep them in the same order every week so readers know where to look.
Overall status: one colour (green, amber or red) plus one sentence explaining why.
Done this week: finished work, not activity. "Homepage design approved", not "worked on homepage".
Next week: the 3 to 5 things that must happen to stay on date.
Risks: things that might go wrong, each with what you are doing about it.
Blockers: things already stopping work, with who can unblock them.
Decisions needed: what you need from the reader, and by when.
Dates and budget: launch date, any date that changed, and budget or hours used against plan.
If you only have time for two sections, write the overall status and the decisions needed. Those are the ones people act on.
How do you set a RAG status that actually means something?
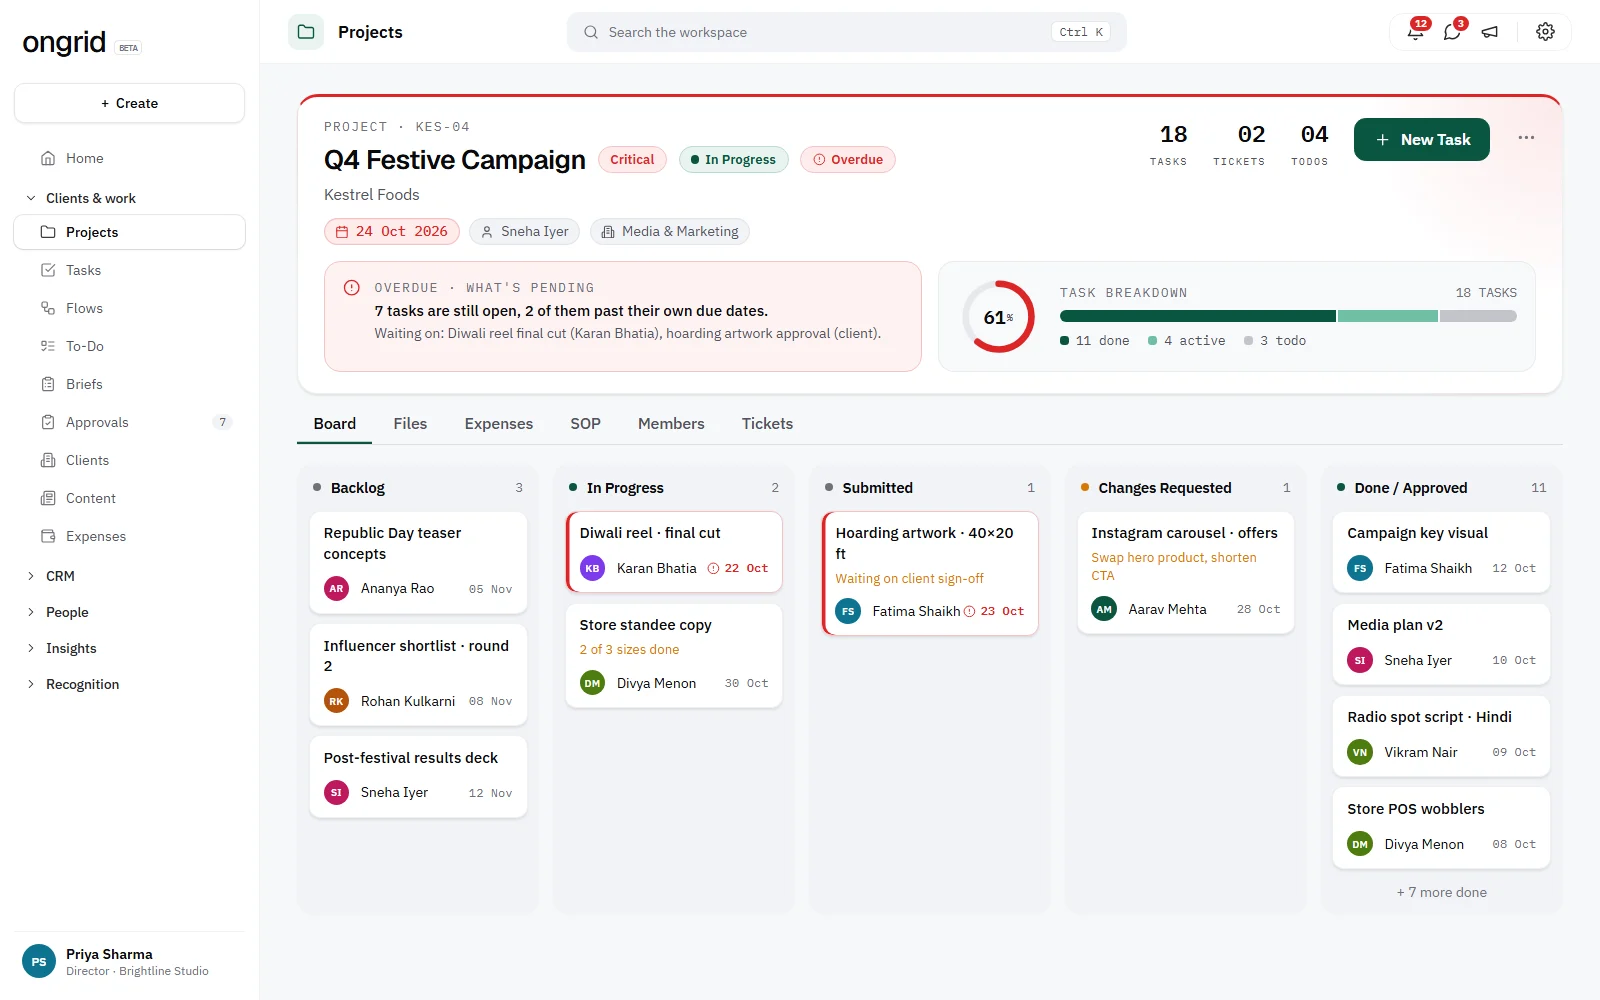
The classic failure is the "watermelon" report: green on the outside, red on the inside. Projects stay green for weeks, then jump straight to red two days before launch. That happens when the colour is a mood, not a rule.
The UK government's Infrastructure and Projects Authority rates its major projects with written definitions for each colour. Green means successful delivery "appears highly likely". Amber means "significant issues already exist, requiring management attention" but they look resolvable. You can read the full scale in the IPA annual report on major projects. You don't need their process, but you should copy the idea: agree the definitions before the project starts.
Here are the rules we suggest for agency work:
Green: on track for the agreed date and budget. No blocker older than two working days.
Amber: the date or budget is at risk, but you can recover this week with a specific action. Amber must always name that action.
Red: the date or budget will be missed unless someone outside the team makes a decision. Red must always name the decision and who makes it.
That last part matters most. A red status with no ask is just bad news. A red status with "approve the reduced scope by Wednesday or the launch moves to 21 November" is something a client can act on today.
[TEAM NOTE: Add a real project of ours that went from green straight to red. What did the report say the week before, what was actually happening, and what rule would have caught it earlier?]
Why "% complete" misleads, and what to report instead
Percent complete is the most quoted number in status reports and the least reliable. Software teams have joked about it for decades. The ninety-ninety rule, credited to Tom Cargill of Bell Labs, says the first 90 percent of the work takes 90 percent of the time and the last 10 percent takes the other 90 percent.
Agency work is no different. Say a website project has 20 tasks and 18 are done. That's 90%. But the two left are "client reviews final pages" and "go live". One depends on someone you don't control. The other is where every surprise shows up.
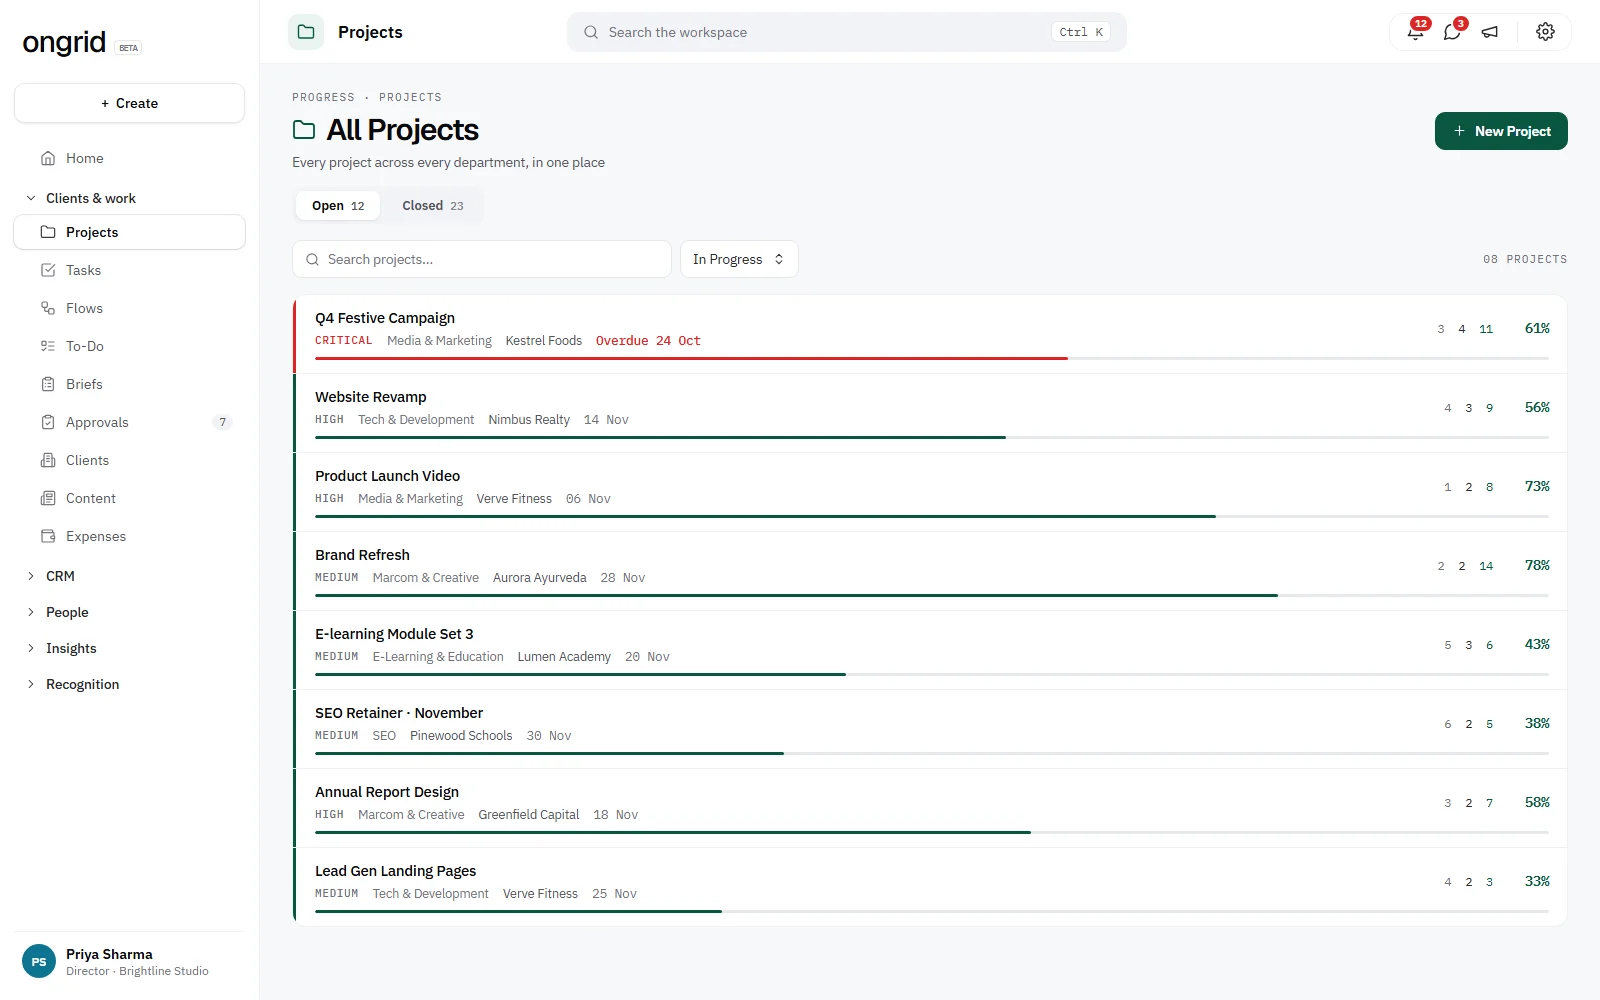
Task counts are still useful. In OnGrid, a project's progress bar is the share of its tasks marked done, which is a quick, honest signal of movement. Just don't let it stand alone. Next to it, report:
Milestones with dates: designs approved, development complete, testing, launch. Each one is done or not done.
What is left: the remaining tasks, with an estimate in days, not a percentage.
Waiting on the client: anything submitted for review and not yet approved, with how many days it has been waiting.
Hours or budget used: if 80% of the hours are gone and 60% of tasks are done, that gap is your real status.
Project status report template (copy and paste)
Copy this into your email, chat or project notes. Replace the brackets. Delete any line that has nothing to report rather than writing "none".
Project: [Client] – [Project name]
Week ending: [Date]
Overall status: [Green / Amber / Red] – [one sentence: why]
Launch date: [Date] ([unchanged / moved from X because Y])
Progress: [X of Y tasks done] · [Z hours used of N planned]
Done this week: [2–5 finished items]
Next week: [3–5 must-happen items]
Risks: [Risk] – [what we are doing about it]
Blockers: [Blocker] – [who can unblock] – [waiting since]
Decisions needed: [Decision] – [from whom] – [by date] – [what happens if not]
Worked example: website redesign for a D2C brand
Here is the template filled in for a real-world style project: an eight-week Shopify redesign for a D2C skincare brand in Pune, billed at ₹4,80,000, now in week 5.
Overall status: Amber – homepage copy approval is four days late; recoverable if approved by Wednesday.
Launch date: 14 November (unchanged)
Progress: 14 of 22 tasks done · 210 of 380 hours used
Done this week: product page and collection page designs approved; collection pages built on staging.
Next week: build checkout flow; connect payment gateway; first round of QA on mobile.
Risks: payment gateway KYC still pending with the client – we have sent the document list twice and booked a call for Monday.
Blockers: homepage copy – waiting on the client marketing lead since 28 October.
Decisions needed: approve homepage copy by Wednesday 5 November, or we launch with the current homepage and swap it in the week after.
Notice what the example does. The amber names the fix. The decision has a date and a fallback. And the numbers line up: 64% of tasks done with 55% of hours used tells the reader the budget is fine even though one item is late.
How do you write it in five minutes every week?
You can't, if you write it from memory. The five-minute version works because the facts already live somewhere. The report is just reading them out in a fixed order.
Open the project and note the progress and the launch date.
Filter tasks completed in the last seven days. That is your "done this week".
Filter tasks that are overdue. Each one is either a risk or a blocker.
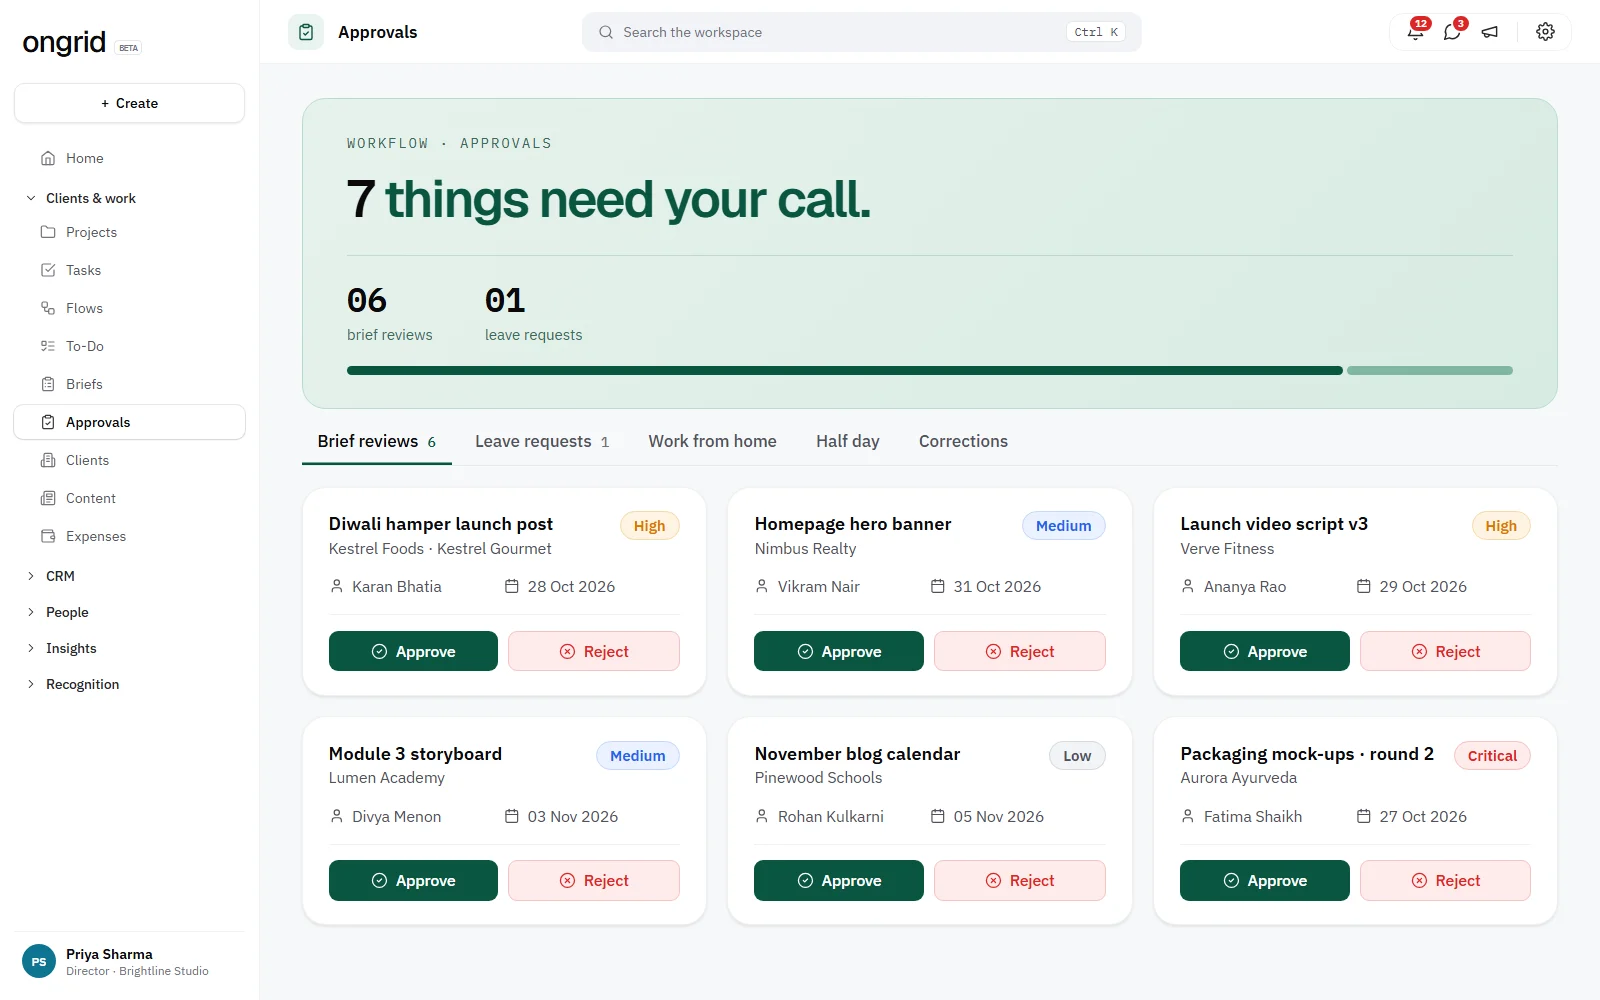
Check what is waiting for review or approval, and for how long. In OnGrid, tasks move through statuses like submitted, changes requested and approved, so anything stuck in review shows up on its own.
Write the status line last, using the rules above, once you have looked at everything.
This only works if the board is up to date, which is a team habit, not a reporting trick. If updates are the problem, start with how to stop chasing your team for task updates. A short daily standup also keeps the board honest, so Friday's report has nothing to dig for.
Pick a fixed slot. Friday at 4 pm works for most agencies: late enough that the week is mostly done, early enough that a client can reply before the weekend.
[TEAM NOTE: Add how long weekly reports took our PMs before we pulled them from the task board, and how long they take now. A real before/after number here is more convincing than any advice.]
Internal version vs client version: what changes?
Use the same skeleton for both. Change the detail.
Internal: full risk list, who is stretched, hours against budget, margin concerns, anything you would not say to the client yet.
Client: status, dates, what's done, what's next and the decisions they own. No blaming individuals. Show hours only if the contract is time-and-materials or a retainer with an hours cap.
One rule covers both: the client should hear about amber from you before they notice it themselves. Most of an agency's amber and red items come from slow feedback, so it's worth fixing the client approval process at the source. If you're running several accounts at once, keep one report per project and a single summary line per client, as in our guide to managing multiple client projects.
What are the most common status report mistakes?
Reporting activity instead of outcomes. "Had three calls about the homepage" tells nobody anything.
Changing the format every week. Readers stop scanning and start skipping.
Decisions with no owner or date. "We need feedback" will get feedback next month.
Hiding capacity problems. If the real issue is that two designers are on four projects, say so internally and look at workload management before it shows up as a missed date.
Not reading last week's report first. If last week promised three things, this week should say whether they happened.
Too long. If it doesn't fit on one screen, the important line is buried. Cut until it fits.
When everything in the report looks urgent, it usually means the plan needs re-ordering, not more reporting. Our guide on how to prioritise tasks in an agency covers that part.
The template is free to copy into whatever you use today. If your tasks, approvals and project progress are spread across chat, sheets and email, the five-minute version gets hard. That's the problem OnGrid is built for: projects, tasks, approvals and your team in one place, so the weekly report is mostly reading, not hunting. You can try it free with your own project.
Frequently asked questions
How often should you send a project status report?
Weekly suits most agency and client projects. Move to daily updates in a launch week or a short sprint where dates change fast, and fortnightly only for long projects where little changes week to week. Whatever you pick, send it on the same day and time every week.
What does RAG status mean in a project report?
RAG stands for red, amber and green, a quick signal of whether a project will hit its date and budget. Green means on track, amber means at risk but recoverable with a named action, and red means it will slip unless someone outside the team makes a decision. Write the definitions down before the project starts so the colour is a rule, not a mood.
How long should a weekly status report be?
Short enough to read on one screen, roughly two minutes. If it runs longer, the decision you need is probably buried. Link out to the task board or files for detail instead of pasting everything in.
What is the difference between a status report and a progress report?
People use the terms loosely, but a status report usually looks forward: will we hit the date, what is at risk and what needs deciding. A progress report or results report looks back at what was achieved. Agencies typically send a weekly status report and a monthly results report to clients.
Should you tell a client when a project is red?
Yes, and as early as possible. A red status that arrives with a cause, a fix and a clear decision for the client builds more trust than a surprise slip later. Clients rarely mind a problem as much as they mind finding it out themselves.